

The DashBord of GoogleApp Engine presents interesting results, but what is the truth behind these data?
I started by deploying a simple Java EE (JSP / Struts / Strus menu) and déploing it in the GoogleApp Engine cloud at http://kbdsoft.appspot.com/
This section aims to: Check the values presented by the DashBord of GoogleApp Engine.
To Check the validity of the values presented by the DashBord of GoogleApp Engine, we use a simulation tool in the classical world of performance studies: the famous Jmeter
Install a simulation tool load
Download Jmeter from http://jakarta.apache.org/jmeter/
Launch Jmeter Script and create a simulation application execution
Beware, the testing was performed on a laptop connected to the Internet with a limited speed, ADSL 1Mb (theoretical), it has no intrinsic value to measure the performance of the platform, but will compare the results .)

Run a simulation of 20 concurrent virtual users (20 Threads)
The scenario is executed 100 times.
http://kbdsoft.appspot.com/pagesManagement.do
http://kbdsoft.appspot.com/menuManagement.do
http://kbdsoft.appspot.com/user.do
http://kbdsoft.appspot.com/audit.do
http://kbdsoft.appspot.com/rolesManagement.do
http://kbdsoft.appspot.com/index.do
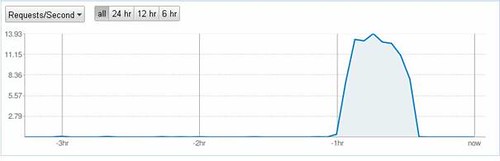
We note that at the beginning of the simulation
We note that at the beginning of the simulation

At the end of simulation the graph Request / Second becomes

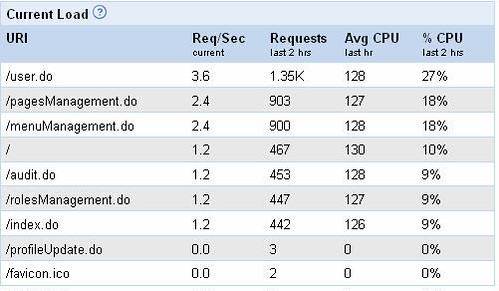
The GoogleApp Engine’s Dashbord allows you to track the behavior of the application: it is the implementation of the concept SAM (Service Activity Monitoring, for monitoring SLAs stipulated in the contract for the paid version)
Thus, after the full execution of the script, the results presented by the GAE's Dashbord are summarized as follows:
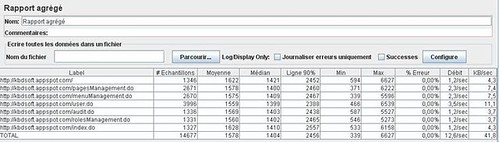
On the other hand, after the end of the execution of the script, the results presented by Jmeter are summarized as follows :
|
| Jmeter
client vue
| GAE DashBord
Google's serveurs vue |
1.135 | 1.2 | |
2.265 | 2.4 | |
2.275 | 2.4 | |
3.411 | 3.6 | |
1.142 | 1.2 | |
1.144 | 1.2 | |
1.147 | 1.2 | |
Total | 12.59 | 13.5 |
The results shown by Google are validated by the results of Jmeter
We can rely on the DashBord.
Conclusion:
For this first test, I "fell in love": it took me half an hour to deploy an old application (simple) Struts based on the Google cloud
No changes were necessary!
(N: there was no transaction, database, Spring, Hibernate ... )
Dashboard of GoogleApp Engine allows to monitor the activity of the application and see the logs and the response time.
Working with GoogleApp Engine is :
- Easy
- Lets recycle "reflexes" of Java developers
- Lets recycle "old" Java
- The Dashboard provides information close to the reality and verifiable
Le cloud coumputing en marche ...


0 commentaires :
Enregistrer un commentaire